
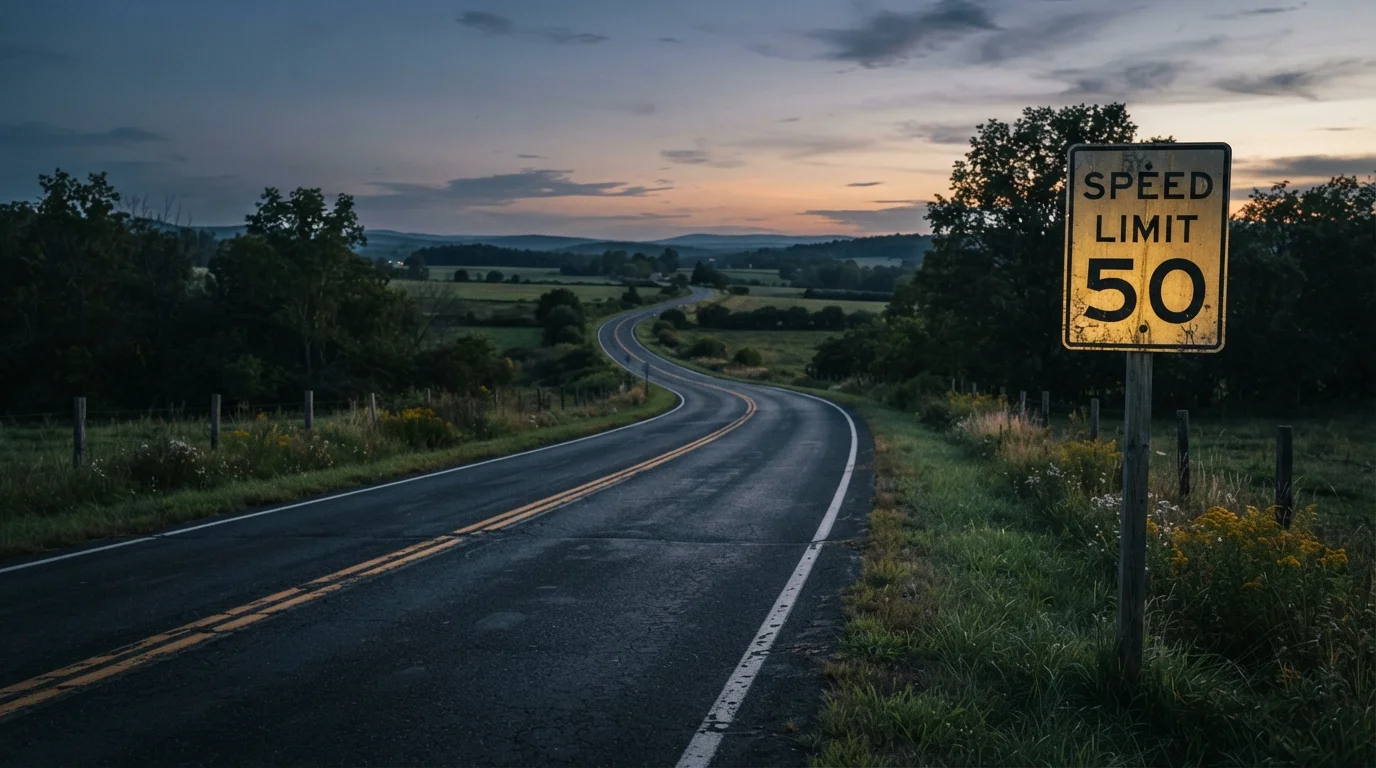
How Speed Limits Are Actually Set
Speed limits don't come from guesswork. Transportation engineers study each road segment using a combination of physical measurements and observed driver behavior. Key factors include sight distance (how far ahead a driver can clearly see), road curvature, the presence of driveways or intersections, and the mix of pedestrians and vehicles nearby.
One widely used method is the 85th-percentile speed study: engineers measure the speed at or below which 85% of unimpeded drivers naturally travel on that road. The theory is that most drivers intuitively pick a speed that feels reasonable for the environment. That observed speed often informs, though doesn't automatically become, the final posted limit.
Local governments, school boards, and public safety officials can adjust limits downward based on crash history, pedestrian activity, or community input. This means two roads that look similar to a driver might carry different limits for reasons that aren't immediately obvious - and understanding that context matters.
Limits Can Vary Even on the Same Road
It's common for a single road to have multiple posted limits along its length. A 45 mph zone may drop to 25 mph near a school or business district, then return to 45 mph after that area ends. These changes reflect changing hazard profiles, not inconsistency. Watch for all posted signs, especially on unfamiliar routes.
The Limit Is a Ceiling, Not a Target
Here is the most important thing many drivers misunderstand: a posted speed limit describes the maximum legal speed under ideal conditions. It is not the speed the road recommends in rain, ice, heavy traffic, reduced visibility, or near active school zones.
Think of it like a weight rating on a shelf. The shelf may be rated for 50 pounds, but stacking it unevenly or adding vibration changes what's actually safe to load. The number on the sticker doesn't update itself for every scenario - and neither does the speed limit sign.
Night driving is a clear example. Headlights on a rural highway typically illuminate roughly 300-400 feet ahead. At 65 mph, a vehicle travels about 95 feet per second. If a hazard appears at the edge of headlight range, braking distance alone may consume most of that space - leaving almost no margin. The speed limit hasn't changed, but the safe speed has dropped considerably.
Adjust Speed Before You Need To
Don't wait until visibility drops or traffic tightens to slow down. Reduce speed proactively when weather changes, when entering a curve, or when approaching an intersection - not after the hazard is already in front of you. Anticipation is the most effective safety tool a driver has.
Speed and Crash Severity: The Physics Aren't Forgiving
Why does 10 extra miles per hour matter so much? Because crash force doesn't scale the way most people imagine. Kinetic energy - the energy a vehicle carries while moving - increases with the square of speed. Doubling speed quadruples crash energy; a 40% speed increase roughly doubles it.
The physics of a road collision make this concrete: at 20 mph, a pedestrian struck by a vehicle has a relatively high chance of survival. At 40 mph, the same collision is far more likely to be fatal. The difference is not linear - the energy involved is dramatically higher, and human bodies absorb it.
This is also why stopping distance is such a critical variable. Reaction time is roughly constant (around 1.5 seconds for an alert driver), but braking distance grows exponentially with speed. The two-second following distance rule exists precisely because speed compresses the time available to perceive and respond to hazards ahead.
4x
Crash energy increase when speed doubles
Because kinetic energy scales with the square of velocity, doubling speed produces four times the energy in a collision, not twice.
~95 ft/sec
Distance covered per second at 65 mph
At highway speed, a vehicle travels nearly the length of three standard car lengths every single second, compressing reaction time significantly.
~1.5 sec
Average driver reaction time
This is the time between perceiving a hazard and beginning to brake - during which the vehicle continues at full speed with no deceleration.
Adjusting Speed for Real-World Conditions
Safe driving means continuously recalibrating speed based on what's actually happening around the vehicle - not defaulting to the posted number and tuning out. Conditions that typically call for speeds well below the posted limit include:
- Wet or icy roads - friction drops significantly, extending stopping distances
- Reduced visibility - fog, heavy rain, and glare all shrink the hazard-detection window
- Heavy or unpredictable traffic - merging vehicles, braking patterns, and lane changes demand more reaction time
- Curves and hills - sight lines are limited, and the road ahead is unknown
- Pedestrian-heavy areas - urban streets, school zones, and parking areas require heightened caution
Risk perception develops with experience, but even seasoned drivers benefit from treating speed as a tool to manage - not a number to reach. The limit tells you the legal boundary. Conditions tell you the safe one.
This article is for general educational purposes. Always follow posted traffic laws and local regulations in your jurisdiction.